Designed a centralized operations platform that replaced fragmented spreadsheets with real-time visibility into client risk, workforce capacity, and financial performance—enabling proactive intervention and scalable growth.
Wisdom’s operations organization had outgrown its tooling. At 260+ managed offices, teams relied on 200+ interconnected Google Sheets to track performance, risk, and workforce activity — creating blind spots, delays, and operational risk.
This project focused on redefining how operations sees the business by designing a unified Management Portal that replaces fragmented reporting with real-time operational intelligence.
I led the strategy and experience design for Management Portal, working closely with Operations, Finance, and Engineering leadership. This wasn’t a UI refresh—it was a rethinking of how information flows through the organization.
My focus was on:
The result is a foundation for an internal platform designed to scale with the business.
As Wisdom scaled, the operations model didn’t scale with it.
By the end of 2025, Operations was managing 260+ offices across 9 Team Leads, with plans to grow to 900+. But the systems supporting that work were built for a much smaller organization. Nearly everything depended on a fragile network of 200+ interconnected Google Sheets that were slow, hard to maintain, and increasingly unreliable.
This created a compounding set of problems across the organization:
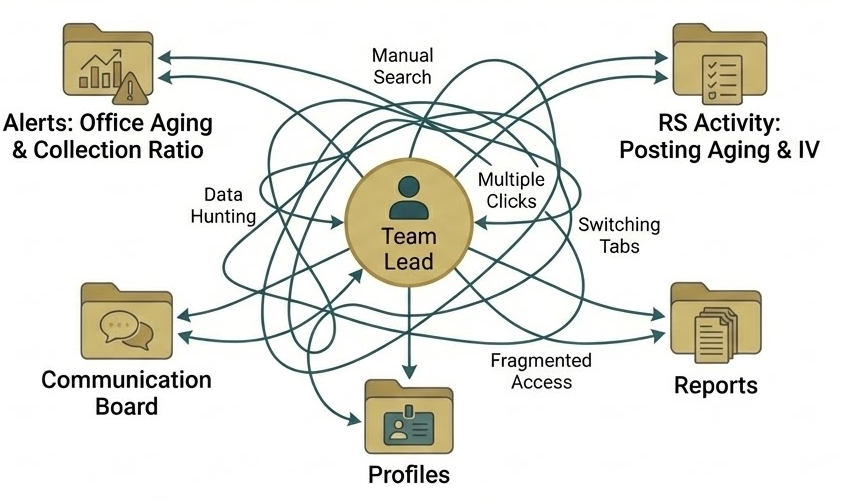
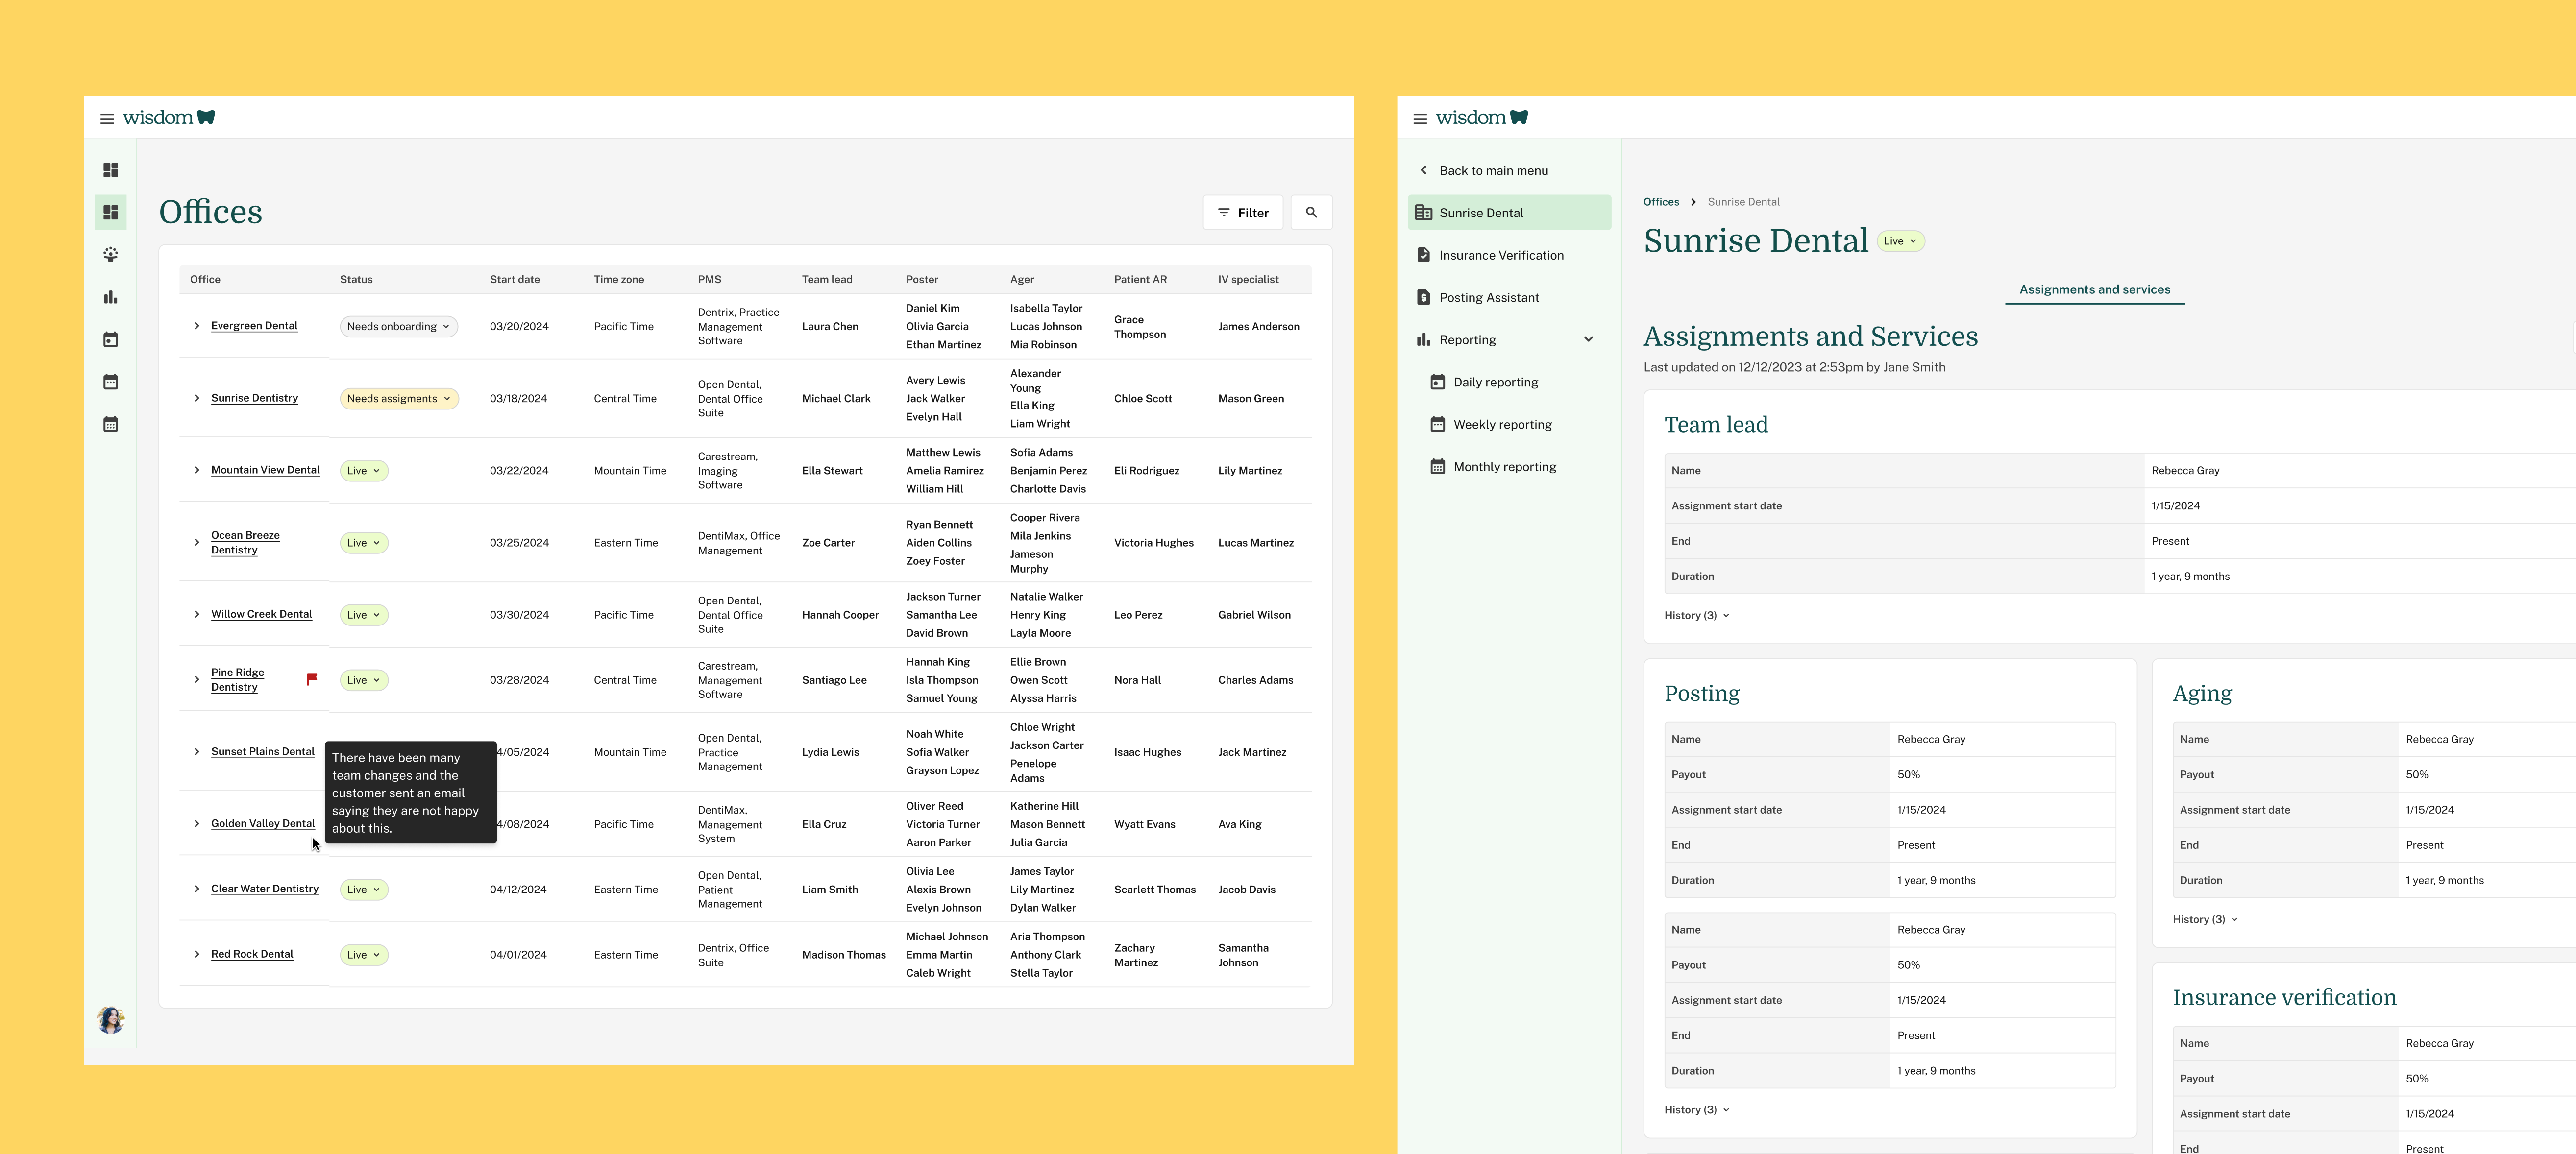
The strongest churn signals—rising A/R aging and declining collections—were buried across spreadsheets. Team Leads often didn’t realize an office was in trouble until aging had already spiked or the client escalated. There was no true early-warning system, no trend visibility, and no shared prioritization model.
“An increasing over-90 balance is a red flag. We need a proactive approach to client management, not something we discover after it’s already a problem.”
— Operations Leadership
Team Leads had no reliable way to see how work was distributed across Revenue Specialists. Assignments were assessed manually by scanning long lists in spreadsheets, making it difficult to spot burnout, over-assignment, or unused capacity. As a result, some specialists were stretched too thin while others were underutilized—without leadership having a clear view of either.
“Information about biller performance and office assignments is scattered across too many places. It’s hard to understand capacity or bandwidth.”
— Operations Leadership
Understanding how a Revenue Specialist was performing across multiple office assignments required jumping between tabs, sheets, and tools. Activity, output, and progress weren’t visible in one place, which meant issues surfaced weeks late and strong performance often went unrecognized.
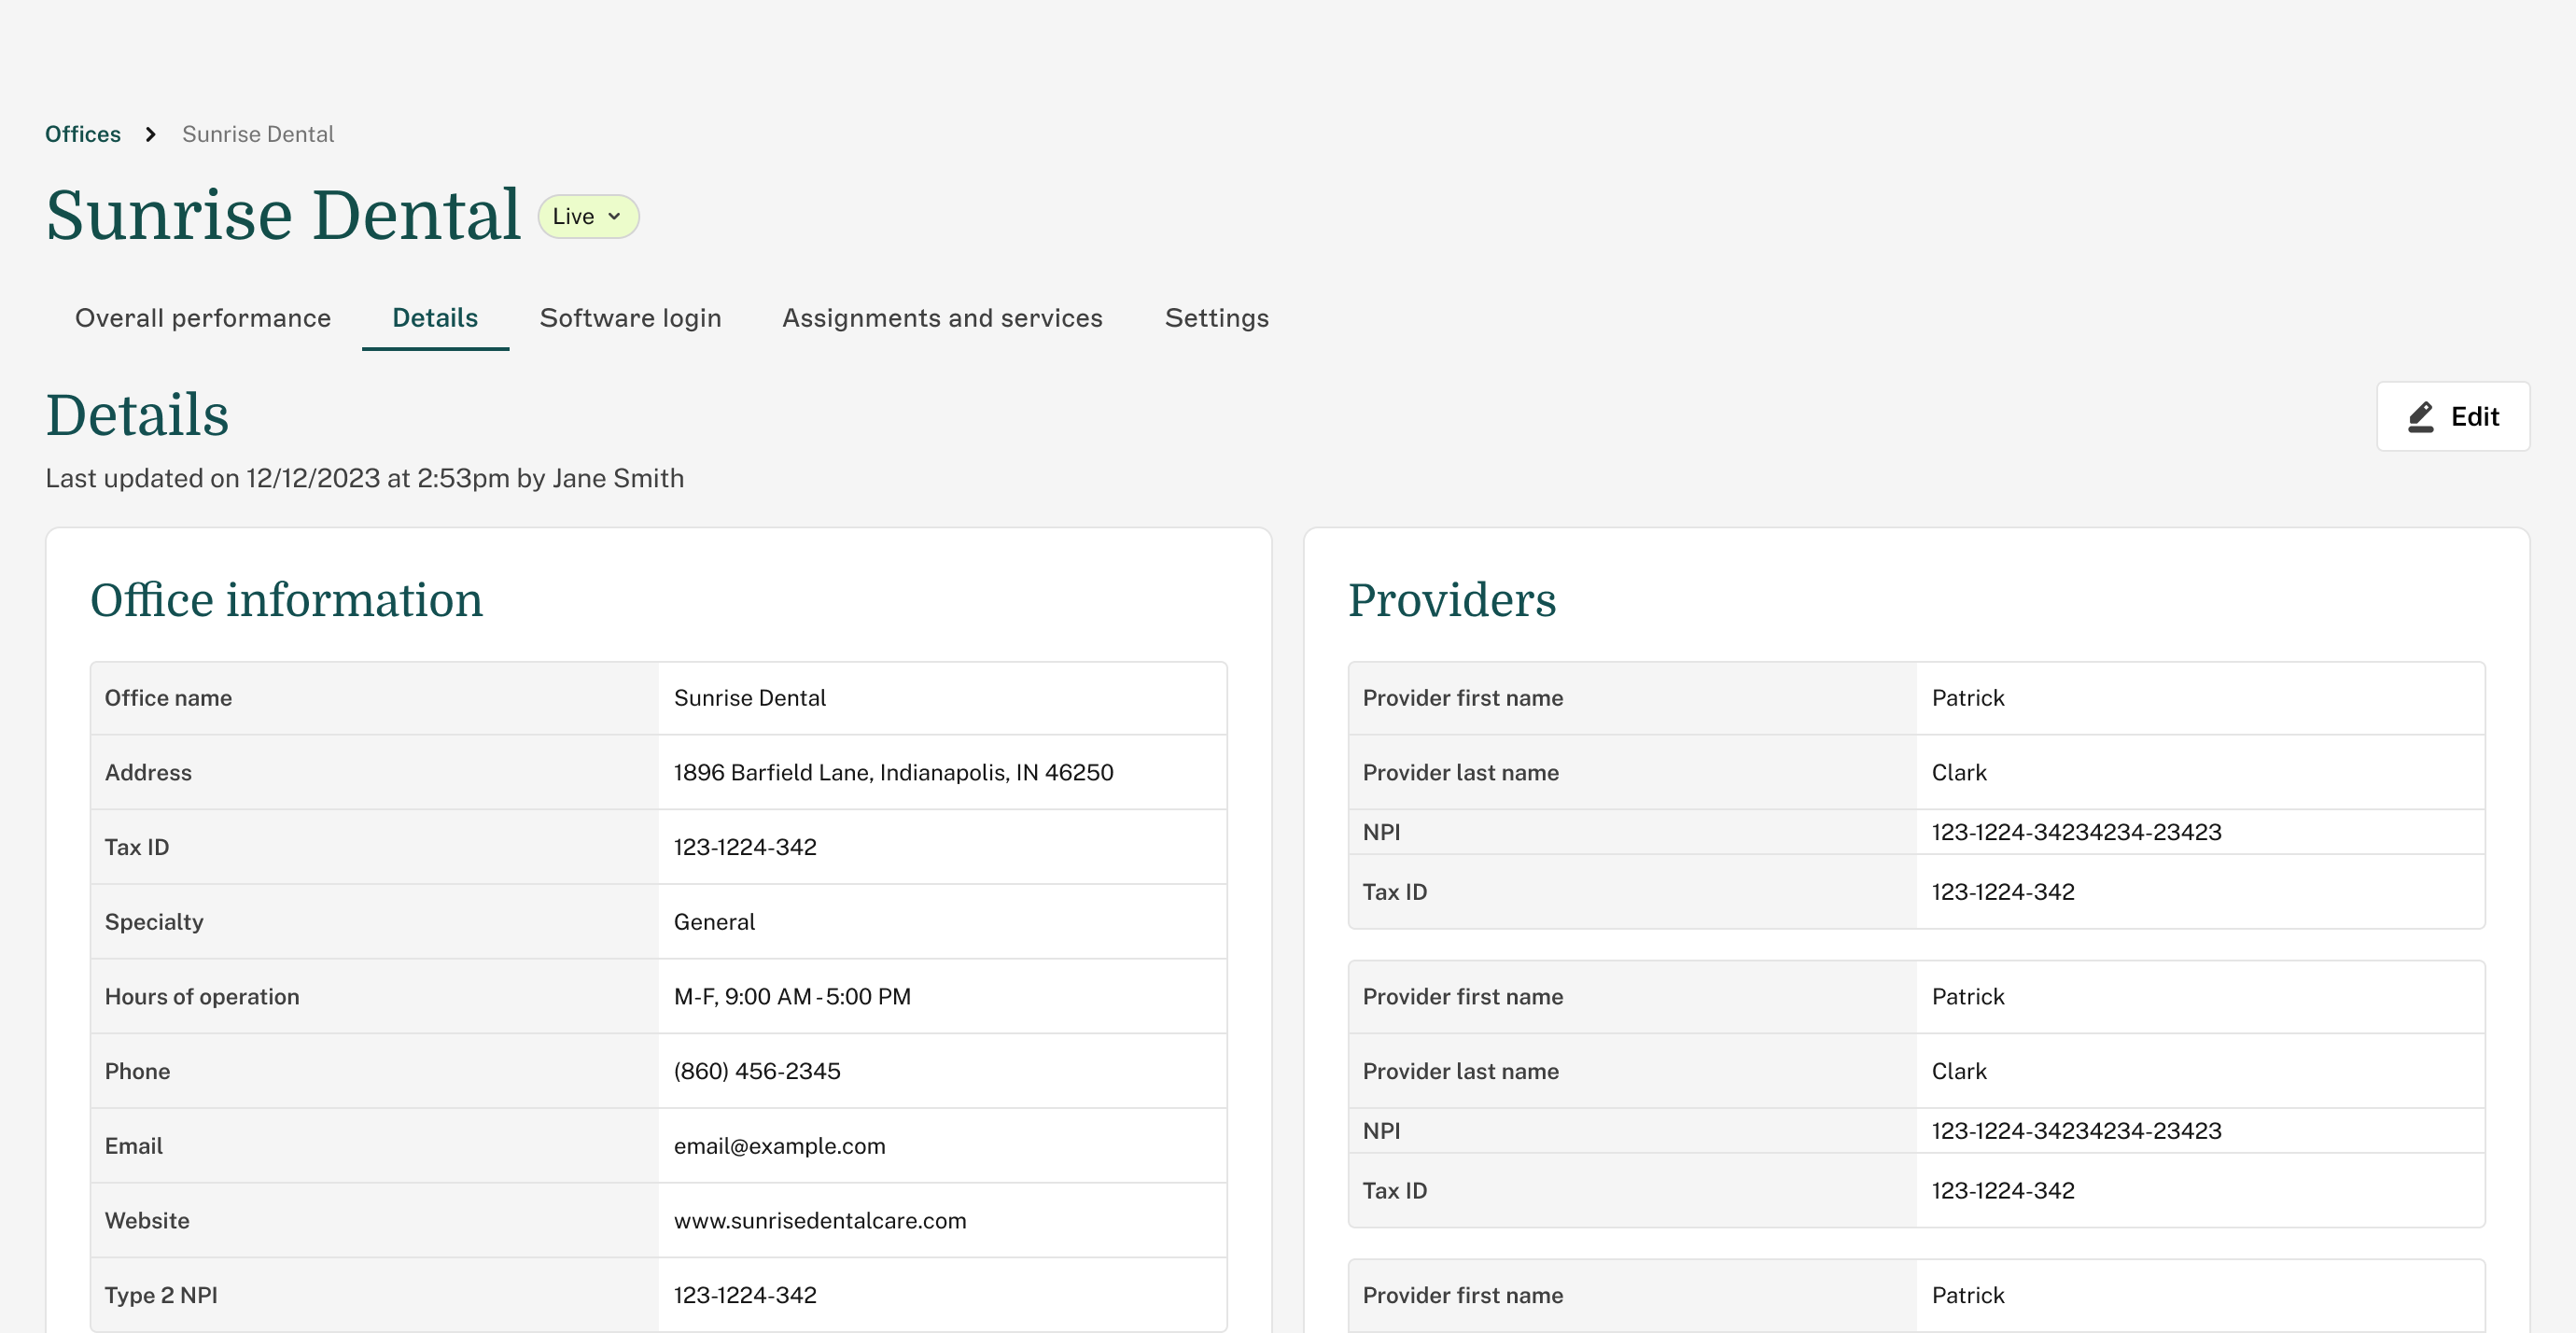
Critical office and workforce data lived in multiple places. Information like Tax IDs, NPIs, logins, assignments, and onboarding details were copied and pasted across systems, increasing the risk of errors and slowing down onboarding. There was no single source of truth for office or workforce profiles.
“We spend too much time manually entering and reconciling data. It introduces errors and slows everything down.”
— Operations Leadership
Leadership lacked visibility into how services were being used, added, or upgraded over time. This made it difficult to validate pricing models, understand expansion opportunities, or connect operational performance to go-to-market decisions.
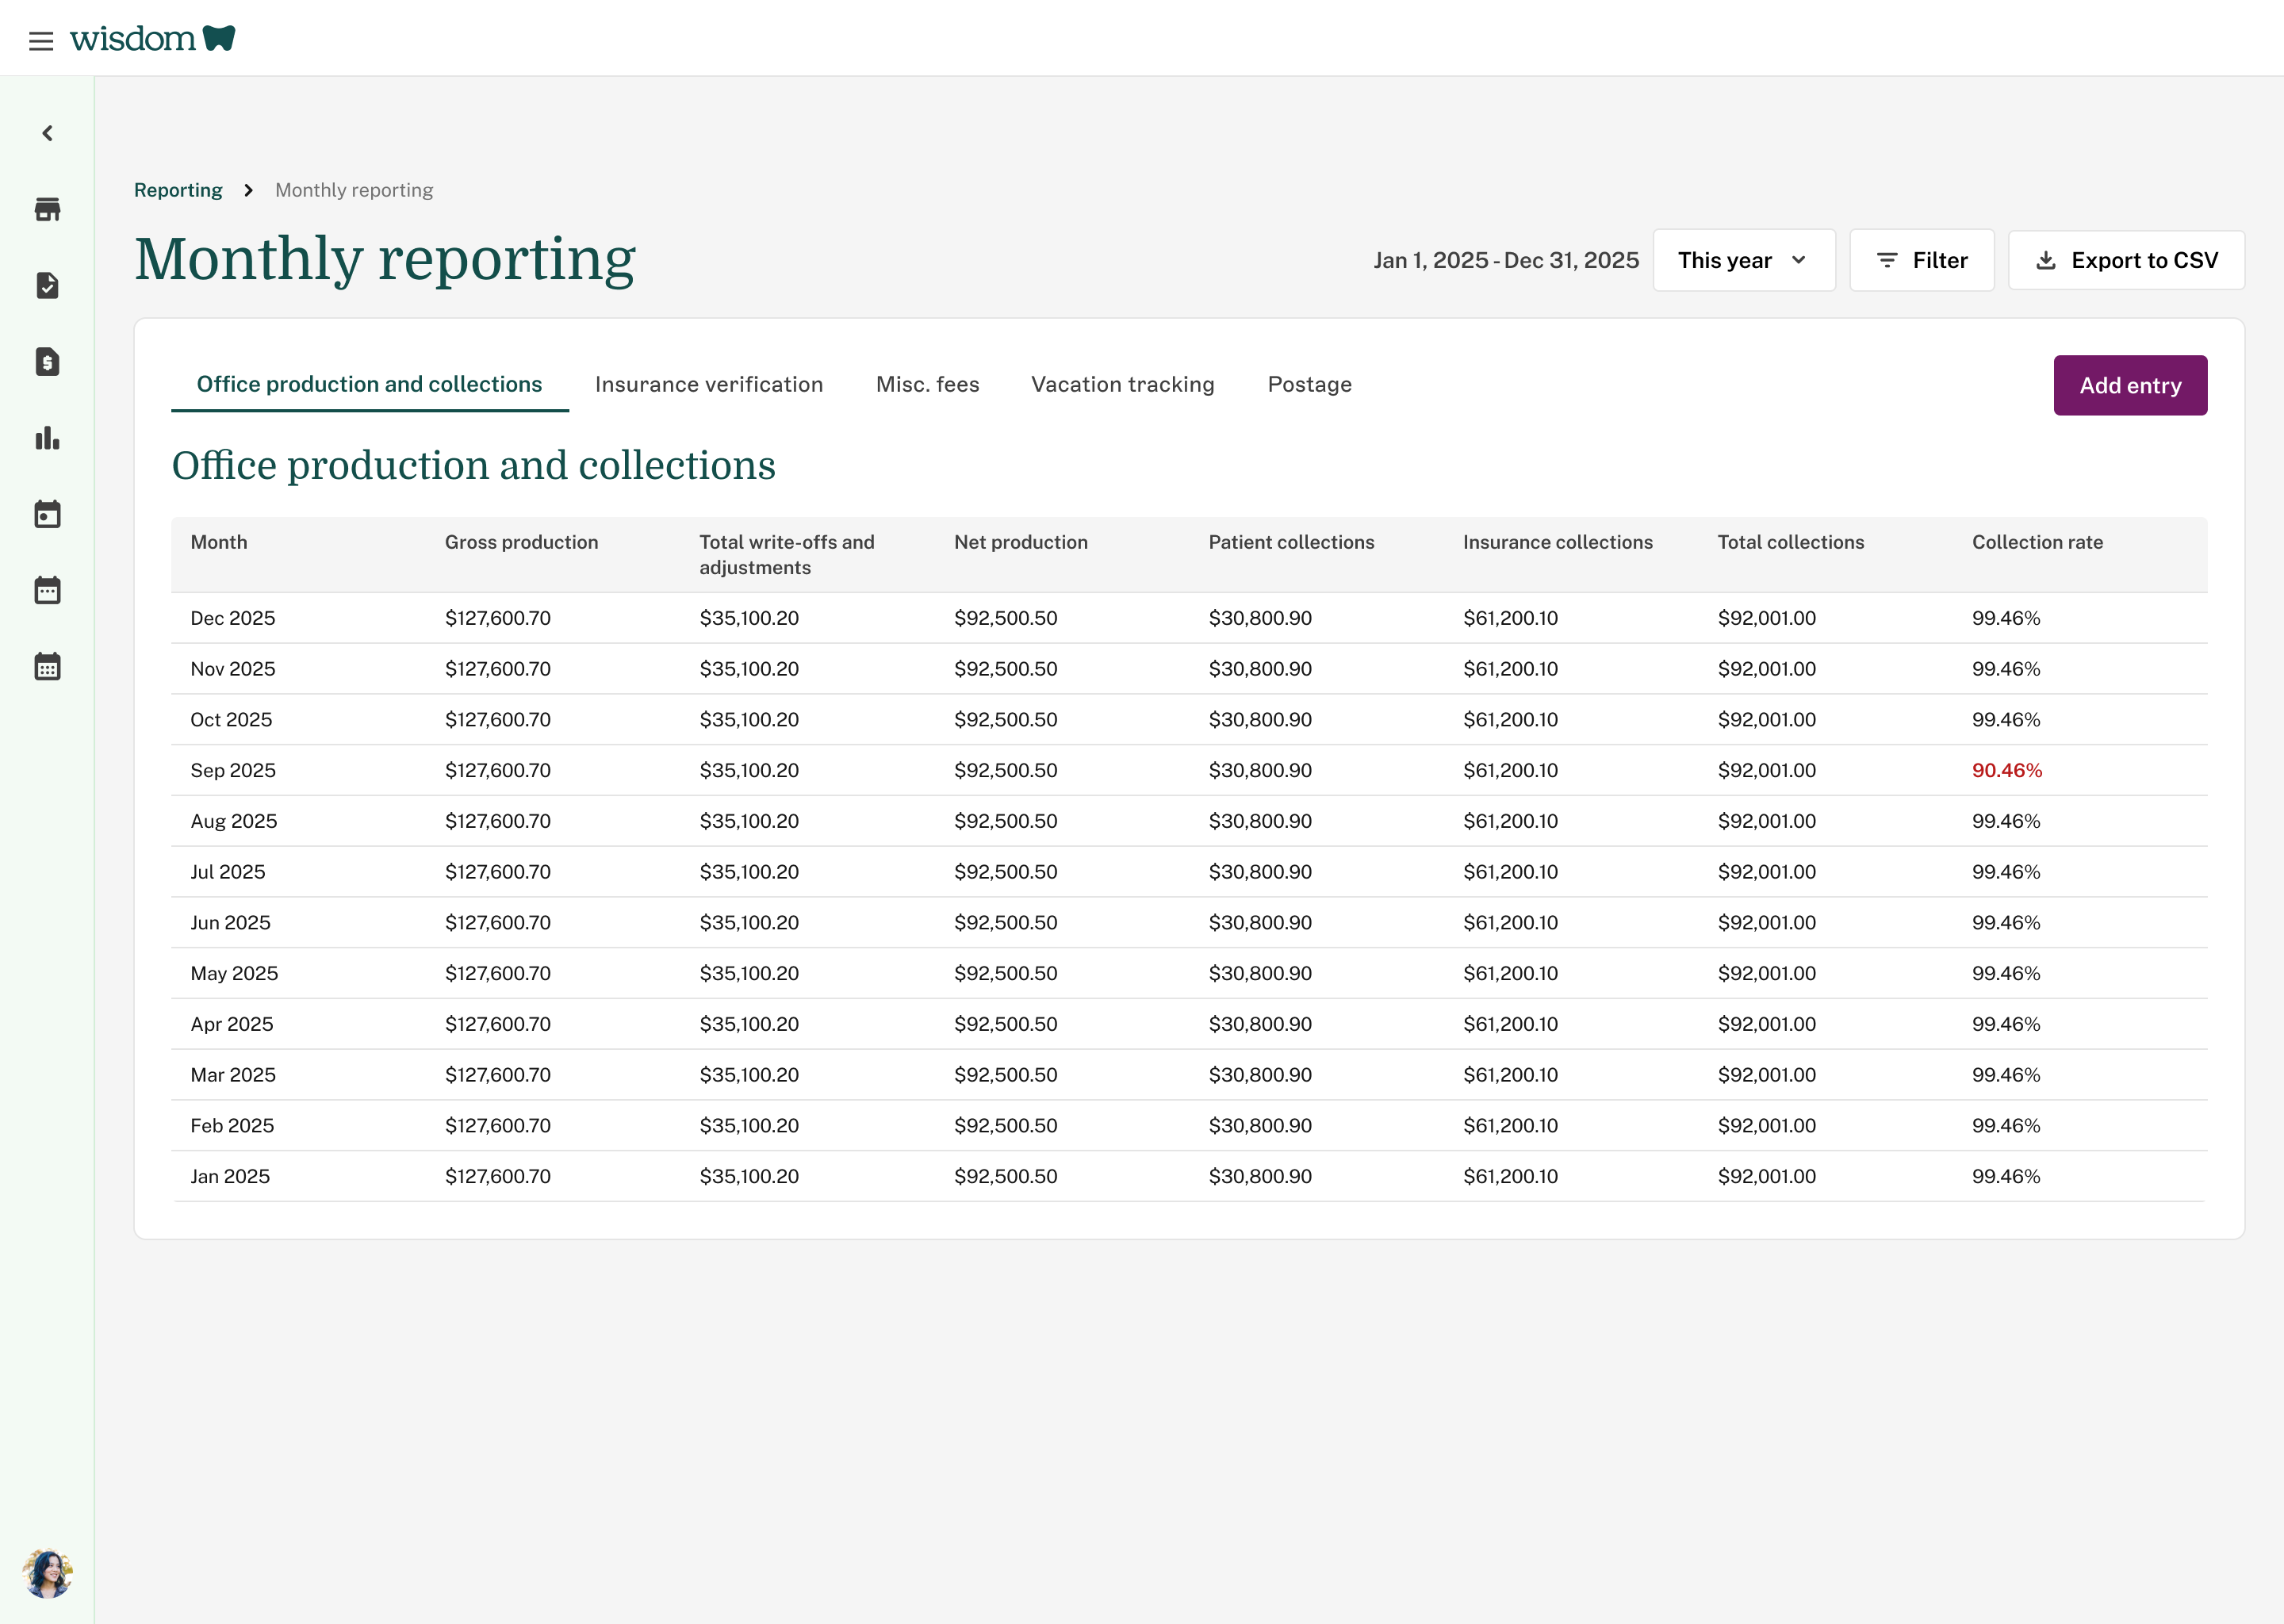
Reporting relied on manual exports and reconciliation, introducing errors and delays. Payroll, invoicing, and audits were harder than they needed to be, and leadership didn’t have real-time insight into cash flow or operational performance. In some cases, the volume of data caused tools to crash entirely, increasing financial risk.
“The volume of data causes our tools to lag or crash, which puts us at risk of payroll and billing mistakes.”
— Operations Leadership
Across all of these issues, the root cause was the same:
Operations was forced to react to problems instead of anticipating them.
The challenge wasn’t just to centralize data—but to design a system that surfaces risk early, supports better decisions, and can scale with the business without adding operational overhead
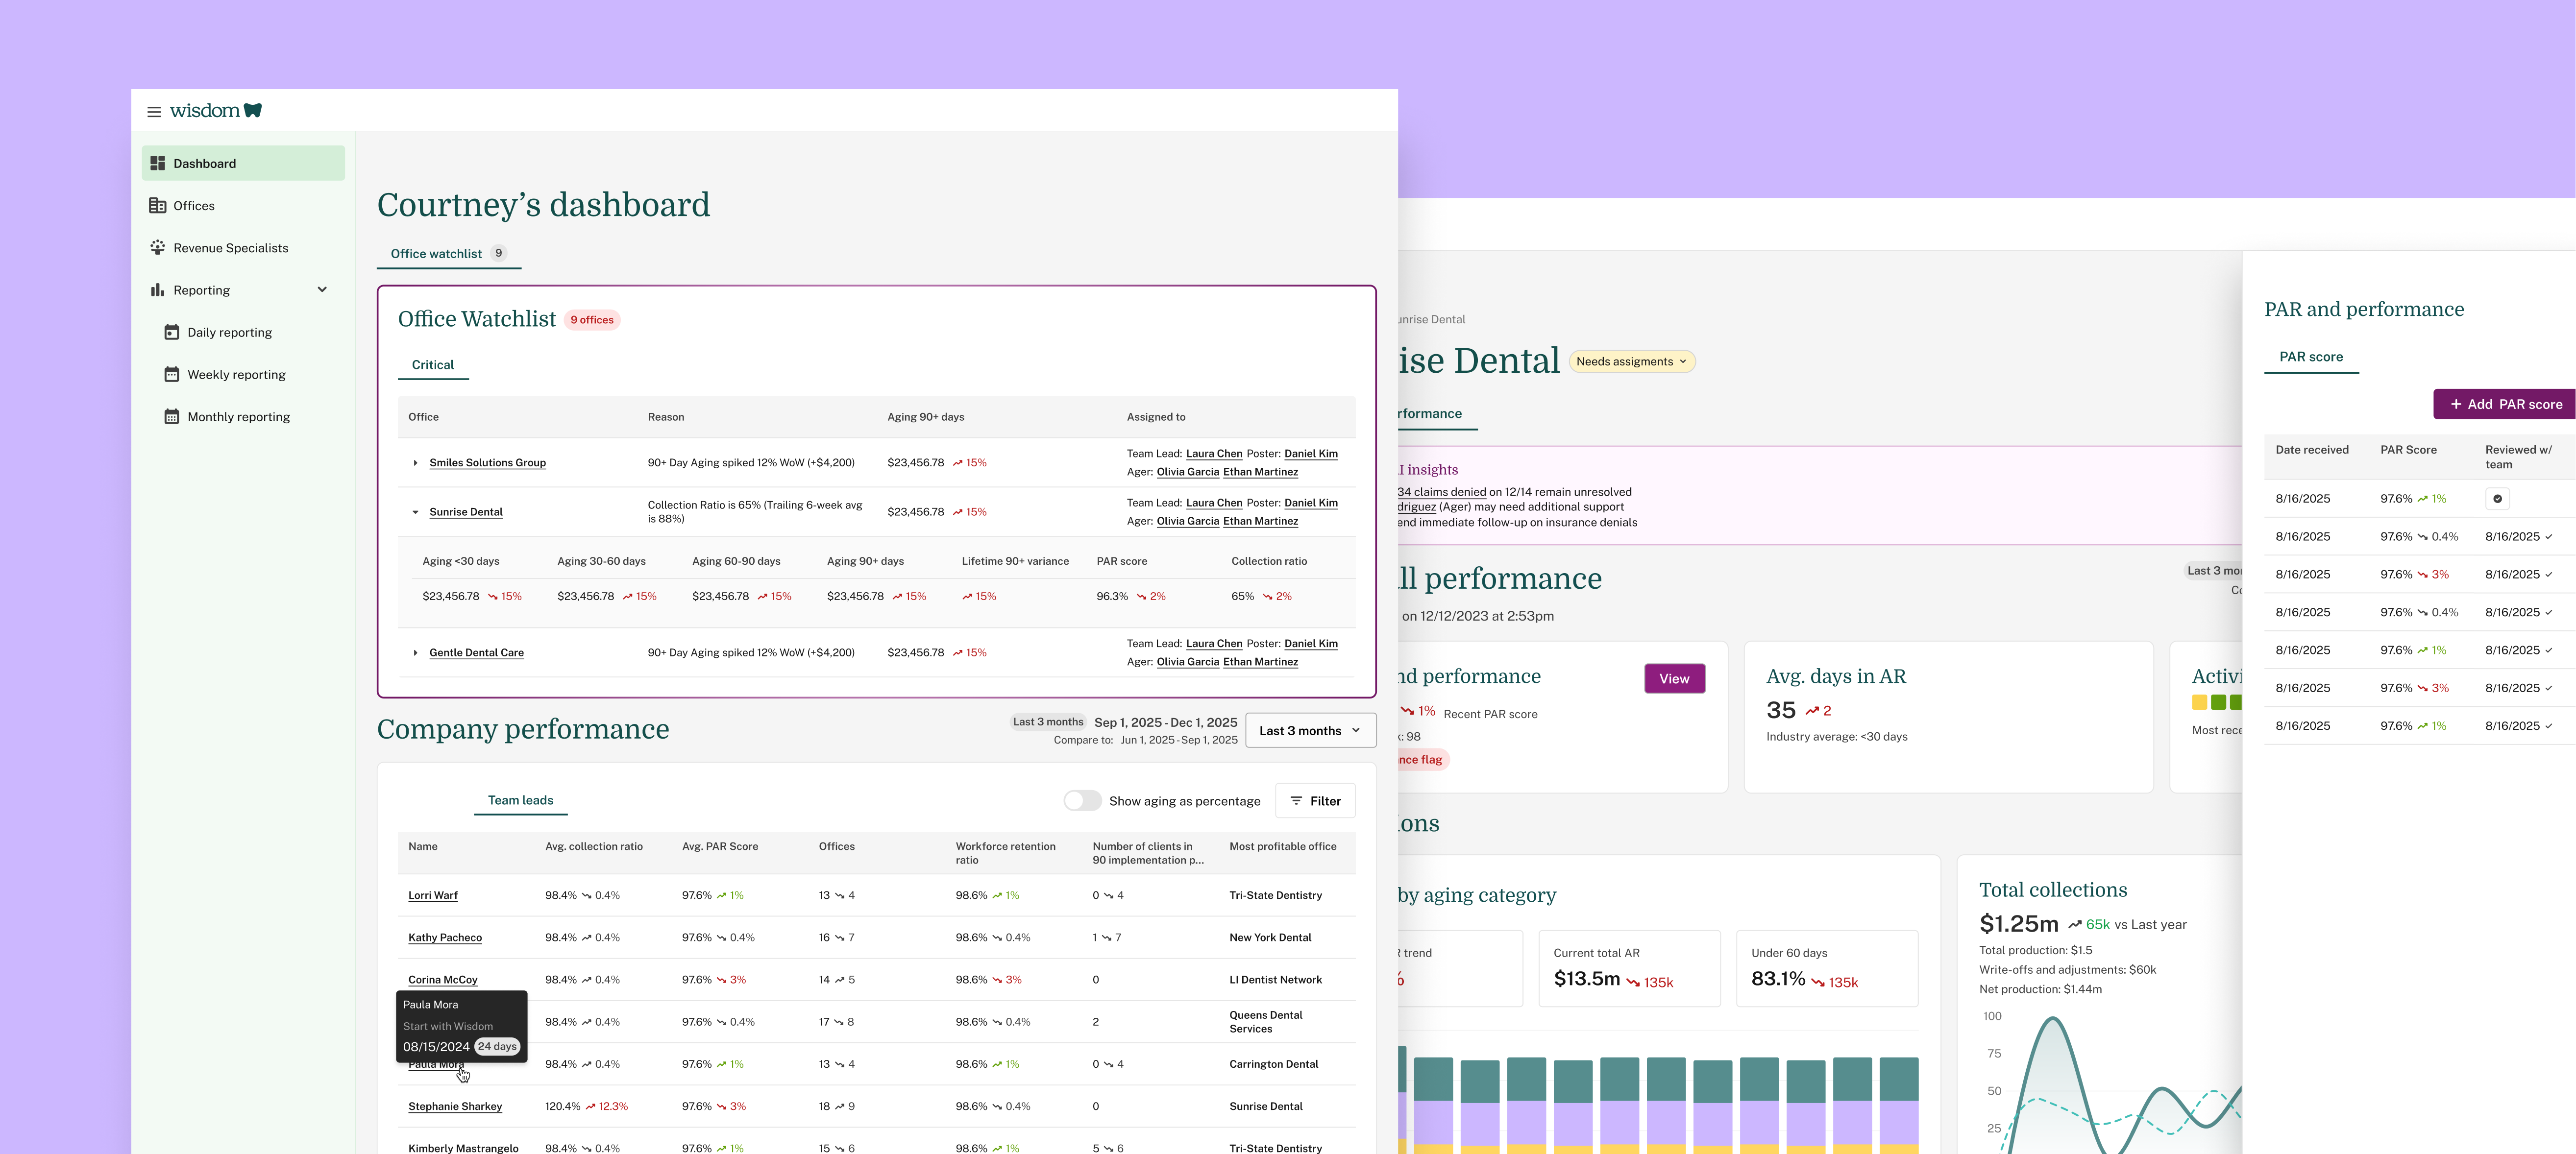
Management Portal was designed as a centralized operations command center—a single place where teams could quickly understand what’s happening, where attention is needed, and what actions to take next.
Rather than building one-off dashboards, the system focuses on surfacing early signals and reducing the effort it takes to stay informed.
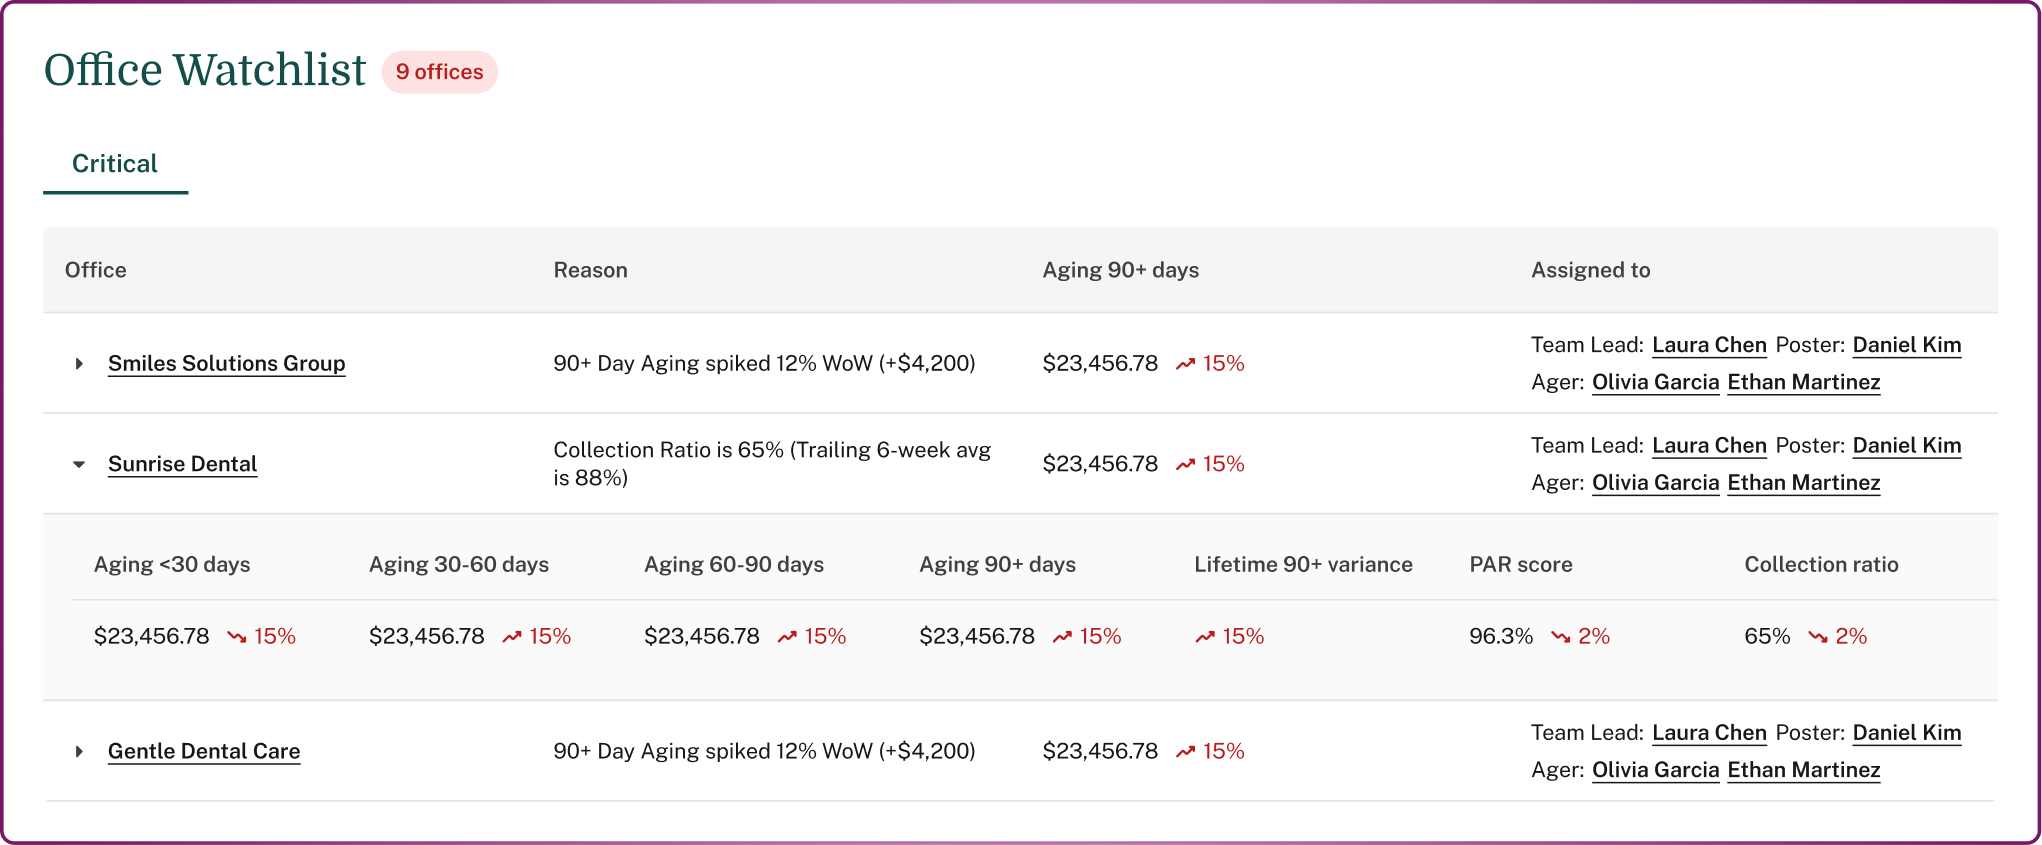
I designed an Office Watchlist powered by an LLM that continuously evaluates aging signals and flags offices when A/R aging crosses defined thresholds (ex: over-60 / over-90 balances, rapid week-over-week changes, and sustained negative collection trends).
Instead of Team Leads digging through spreadsheets to “find the fire,” the Watchlist:
The result: a true early-warning system that surfaces issues weeks earlier than manual monitoring—without turning the product into another noisy dashboard
Data in → signal out:
Why LLM (not just rules):
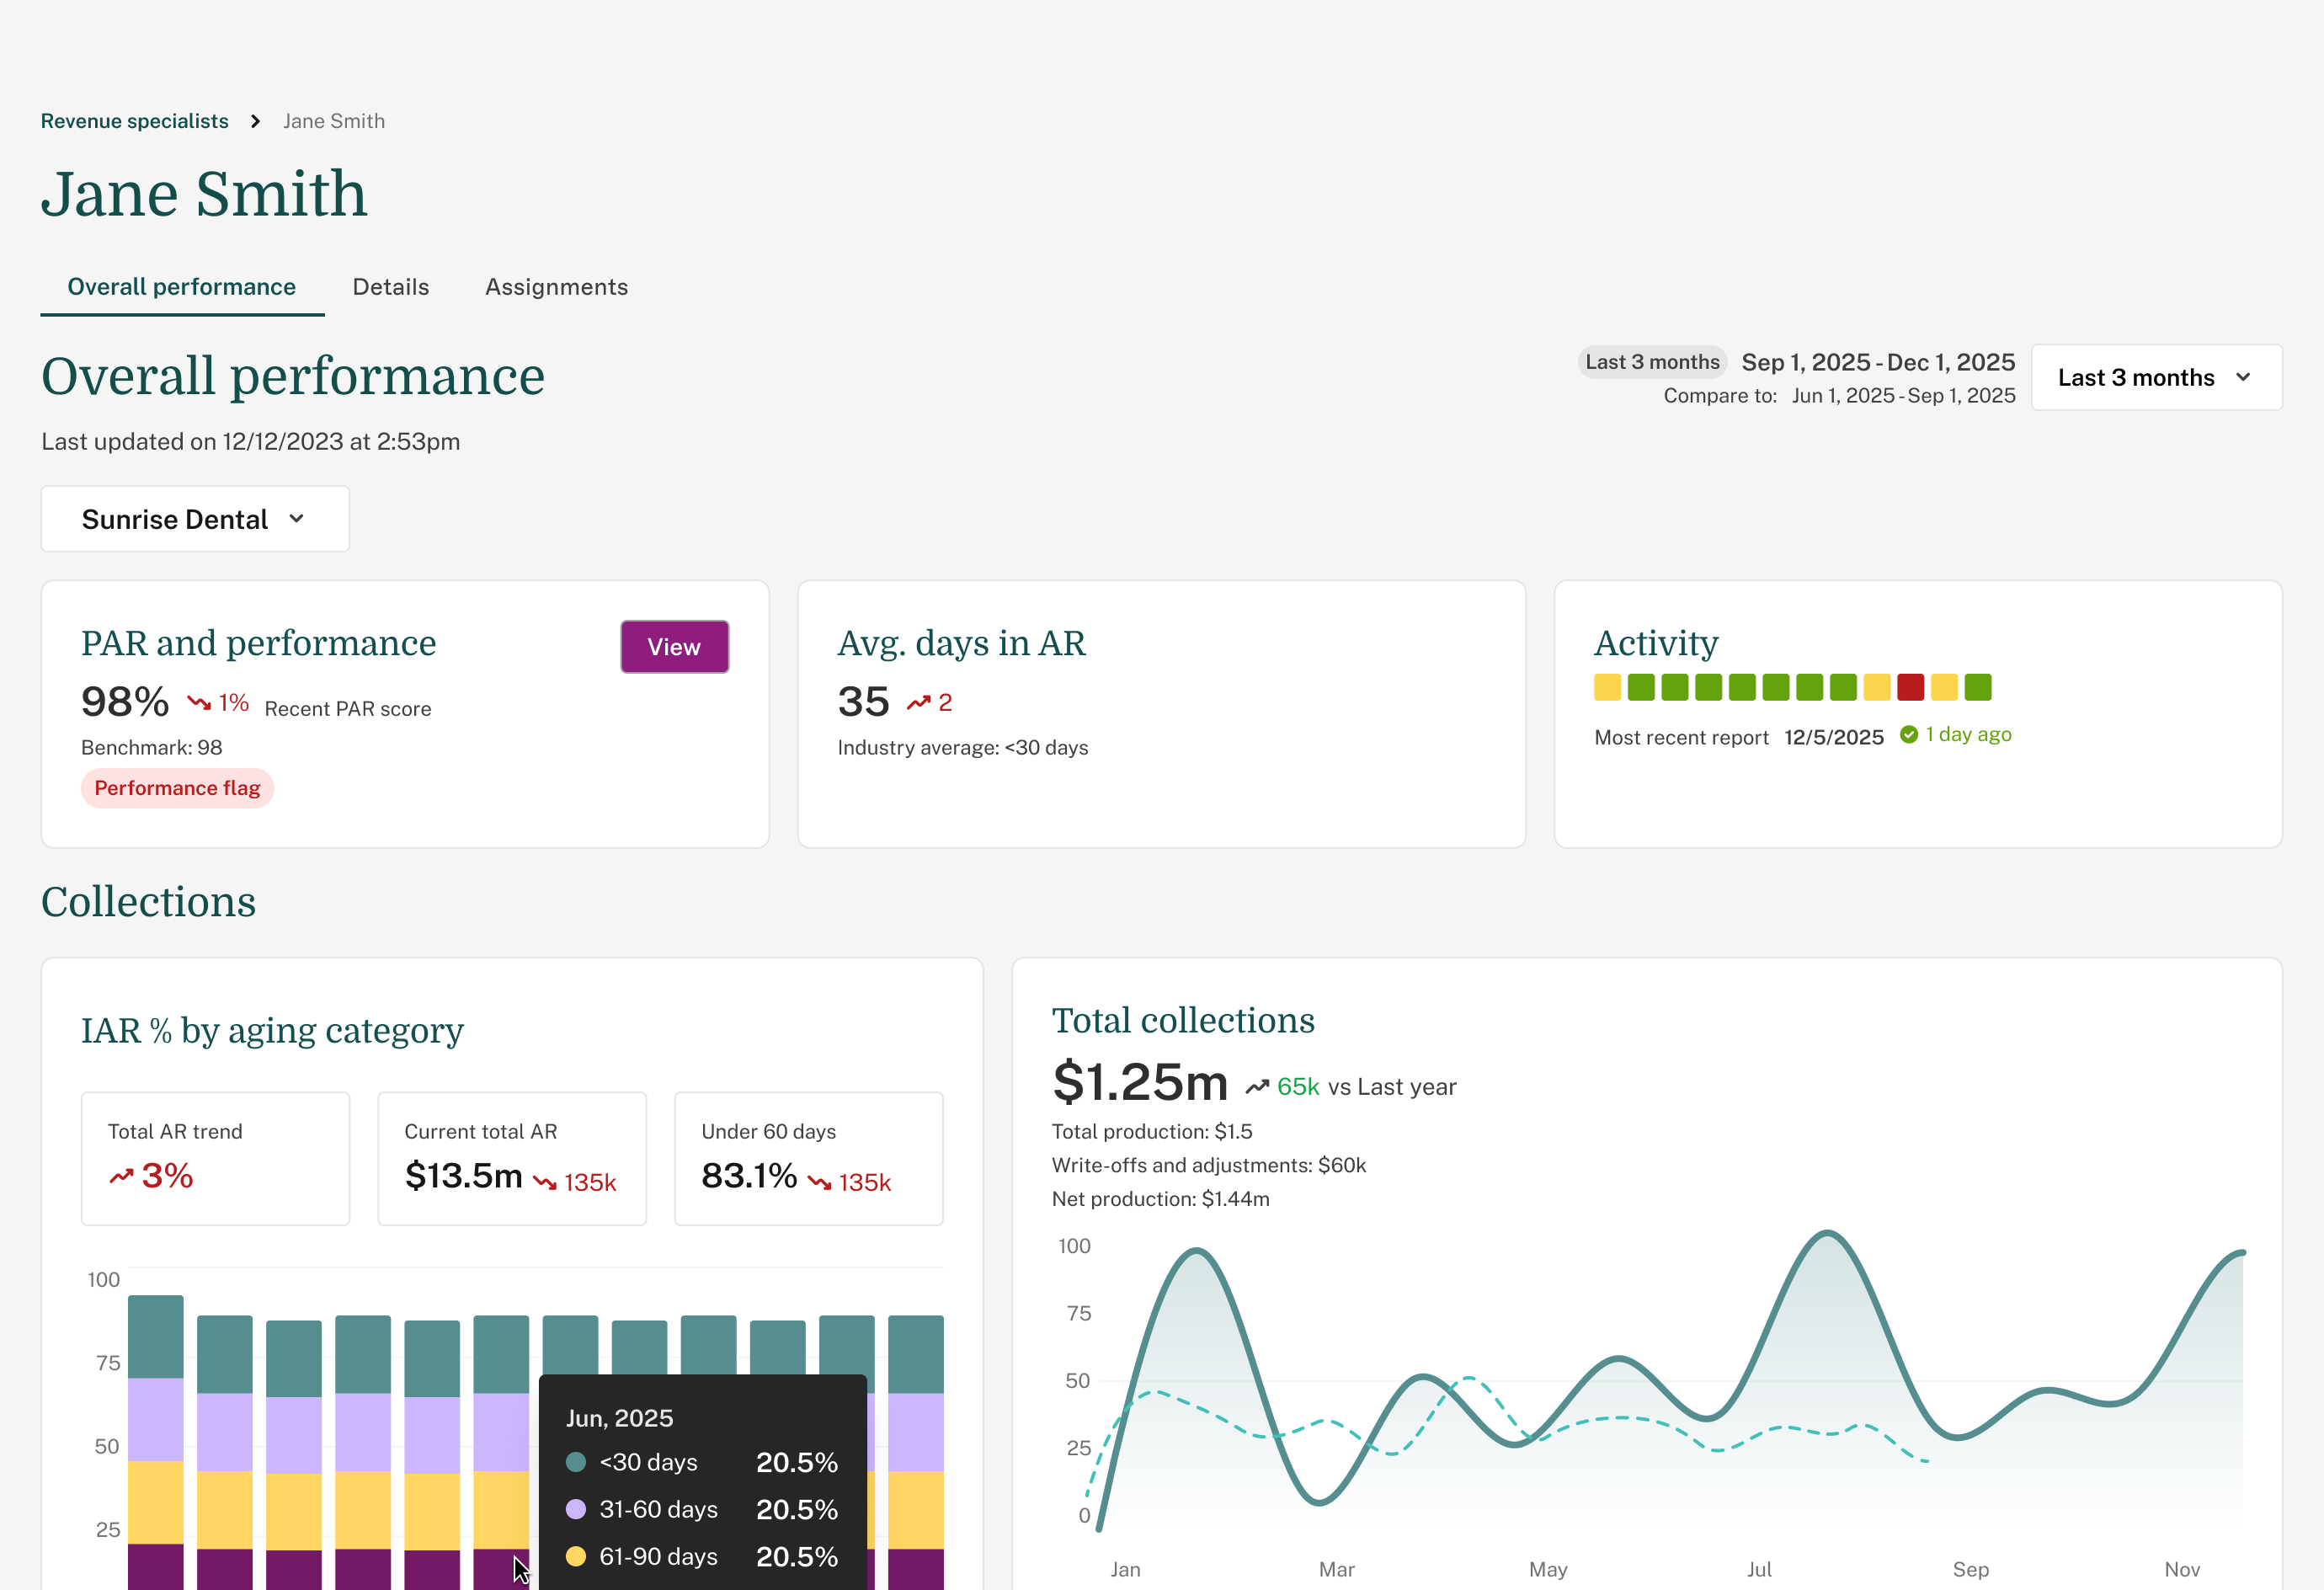
To address burnout and underutilization, I introduced clear views into Revenue Specialist workload and capacity. This makes it easier to balance assignments and understand where teams are stretched—or where there’s room to take on more.
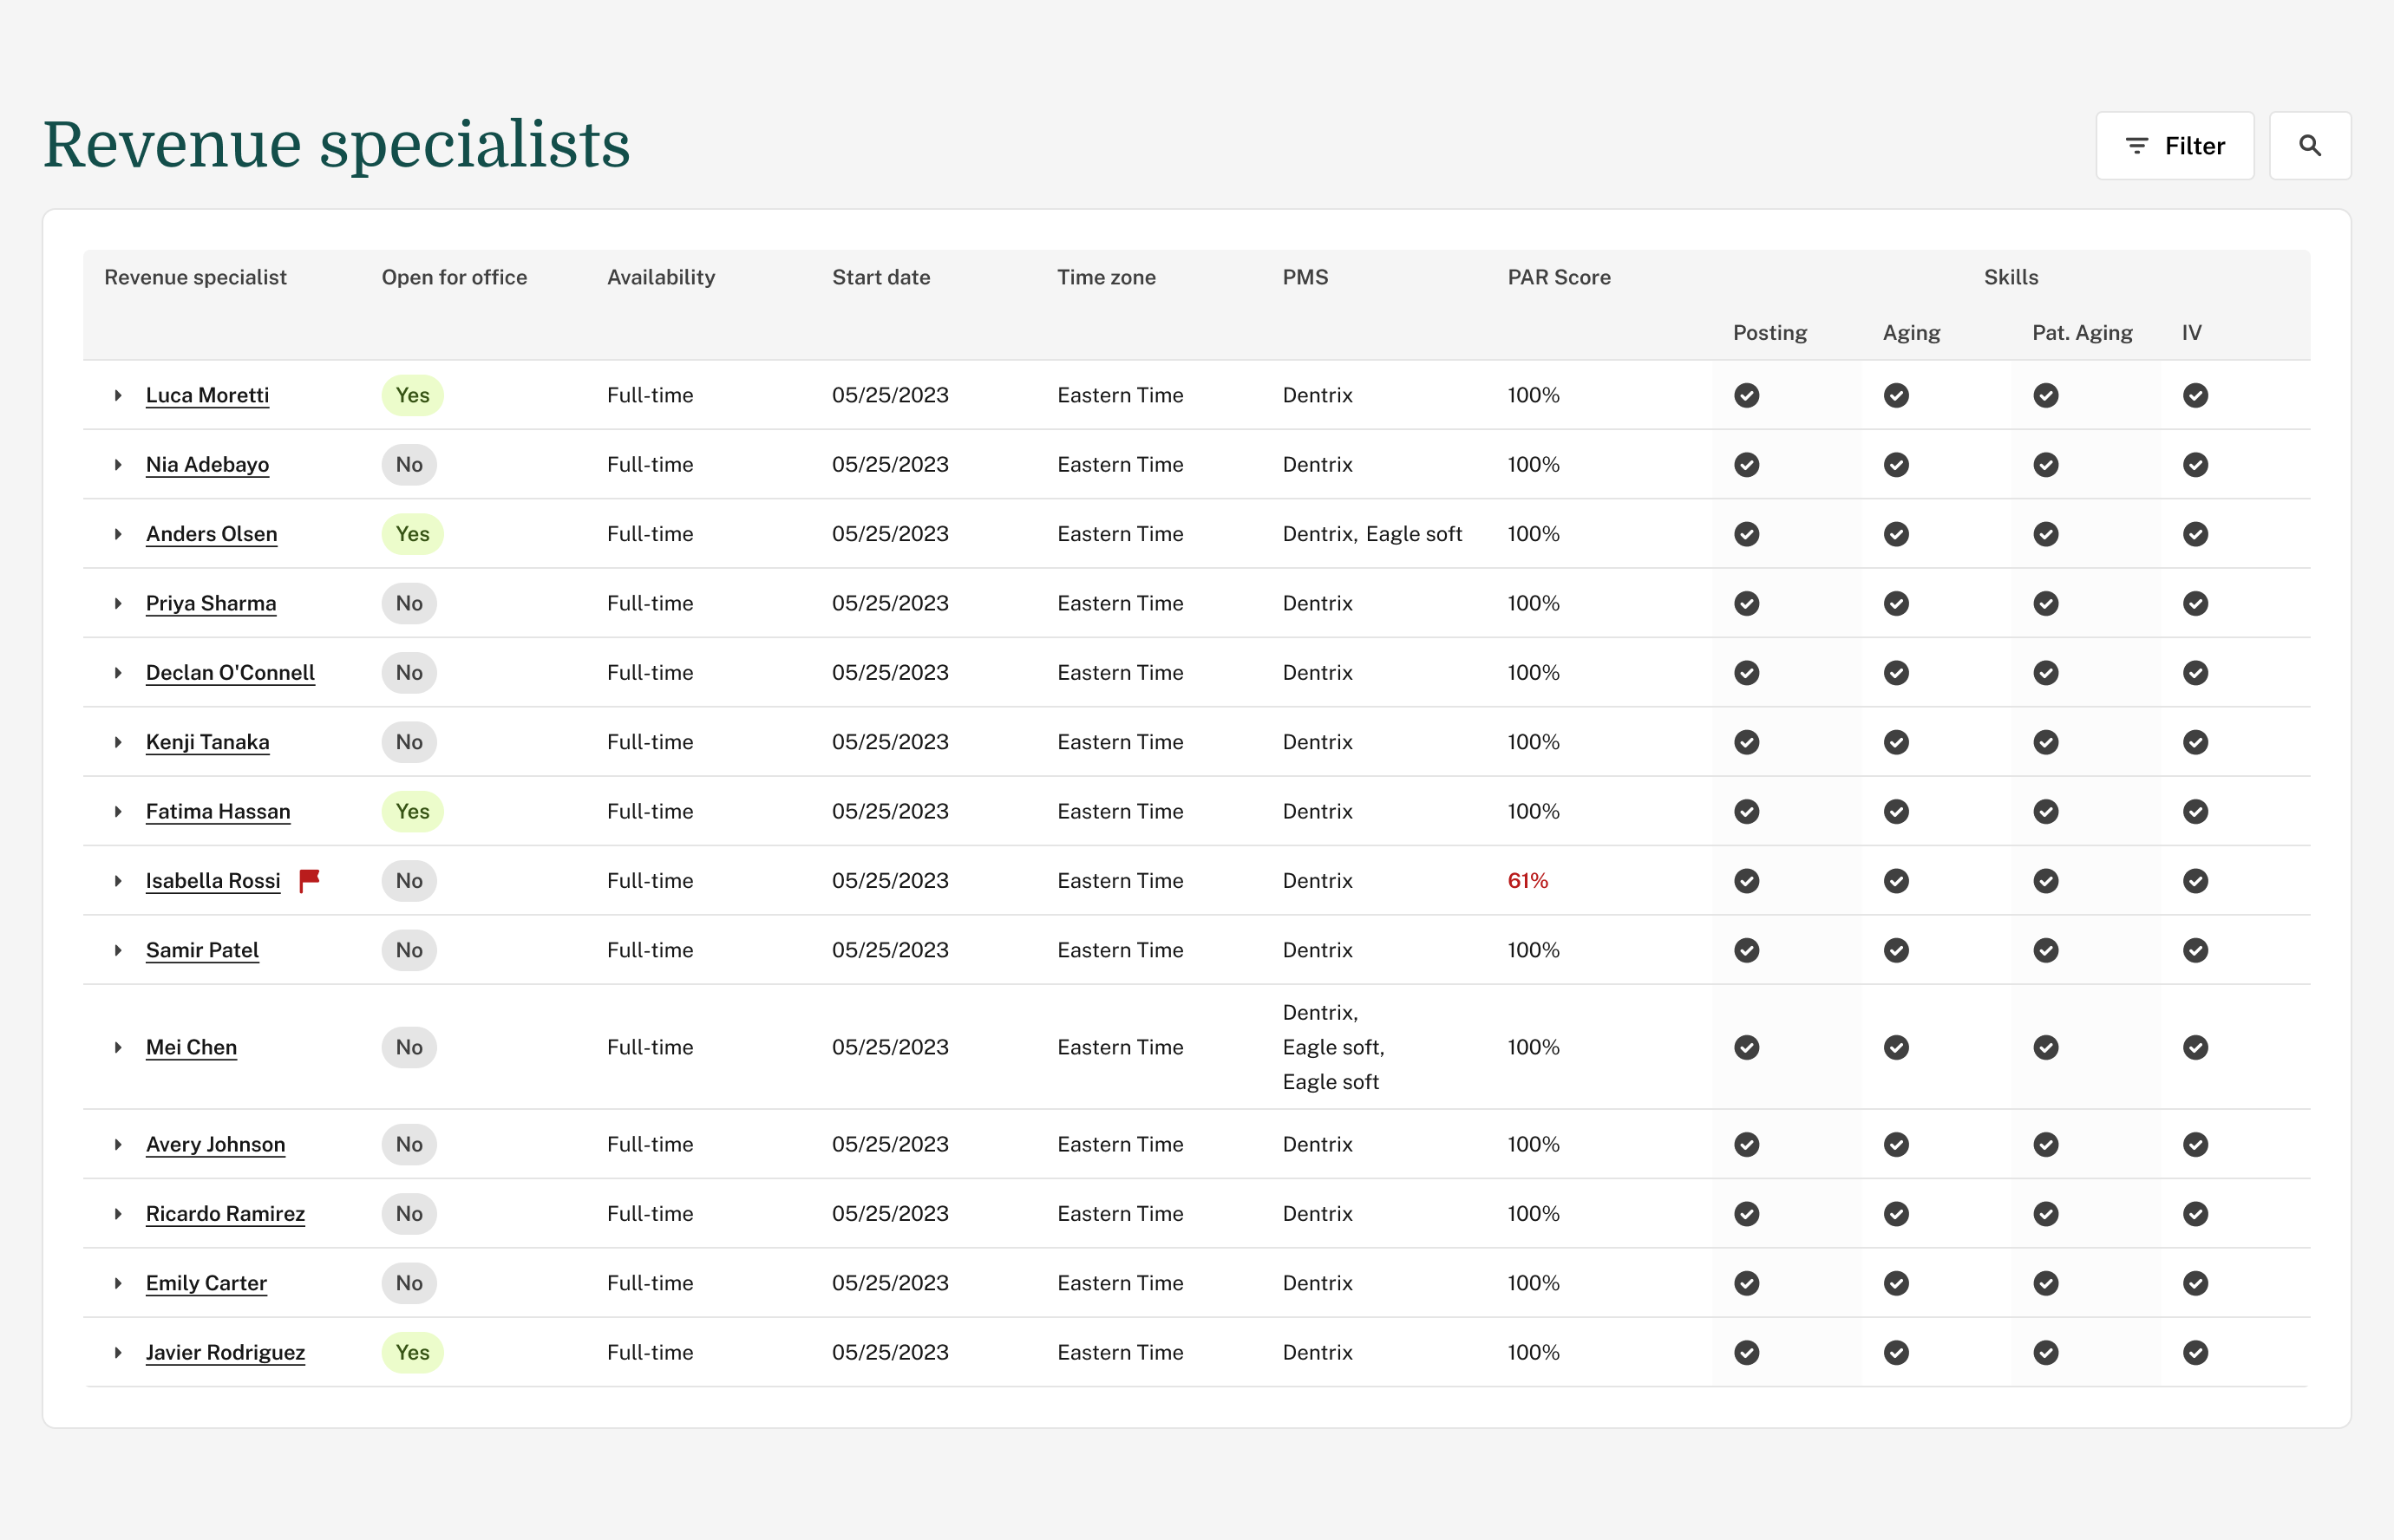
Each Revenue Specialist has a dedicated view that shows how they’re performing across assignments. This gives Team Leads better context for coaching, feedback, and recognition without creating a culture of micromanagement.
Office and Revenue Specialist information is now centralized. Data is entered once and reused across the system, reducing manual errors and making onboarding and day-to-day operations much smoother.
Leadership gets portfolio-level and company-wide views that surface trends, risk, and usage without having to request reports or pull data from multiple tools.
Manual PDFs and spreadsheets were replaced with in-app reporting and production tracking. This improves accuracy for payroll and invoicing and gives Finance better real-time visibility.
Management Portal is currently in development, with planned rollout across Q1–Q2 2026. The outcomes below reflect the intended impact of the platform based on defined goals, operational baselines, and leadership alignment.
One of the primary goals of Management Portal is to reduce customer churn driven by insufficient revenue collection. As of Q4 2025, Wisdom’s churn rate sits at 1.8%, with aging A/R and declining collections being the most common early indicators of churn.
Management Portal is designed to surface these signals earlier—before they escalate into client complaints or cancellations—through automated office watchlists and risk states. By giving Team Leads clear, prioritized visibility into offices that are trending in the wrong direction, the platform enables earlier intervention and more proactive client management.
Projected impact:
Today, Team Leads and Managers rely heavily on layered Google Sheets to understand performance, workload, and risk. This slows decision-making and creates dependency on manual reporting.
Management Portal centralizes this information into a single system designed for daily use. The goal is not just visibility, but adoption—making the portal the first place Team Leads go to understand what’s happening across their portfolio.
Projected impact:
As the business scales, operational efficiency must improve without sacrificing service quality. Wisdom’s NPS was 73.47 as of Q3, exceeding the target of 70+, but maintaining that score becomes harder as office count grows.
Management Portal is designed to reduce the cognitive and manual load on Team Leads by eliminating hours of data hunting and replacing it with clear, prioritized views. This allows Team Leads to spend more time supporting offices and less time assembling reports.
Projected impact:
Another key goal is improving overall satisfaction for Team Leads and Revenue Specialists while preparing the organization to scale to 900 offices by EOY. Without visibility into workload and capacity, teams risk burnout on one end and underutilization on the other.
Management Portal introduces clear workload and performance visibility across Revenue Specialists, helping leadership make better assignment decisions and spot issues before they compound.
Projected impact:
Management Portal is not positioned as a quick fix—it is foundational infrastructure. The platform is being built to help Wisdom operate more proactively, reduce preventable churn, maintain service quality at scale, and give teams the clarity they need to make better decisions every day.
By the time it launches, success won’t be measured by dashboards alone—but by how effectively teams can anticipate problems, act earlier, and scale without losing control.